
What Is the Win Rate of Forex Signals?
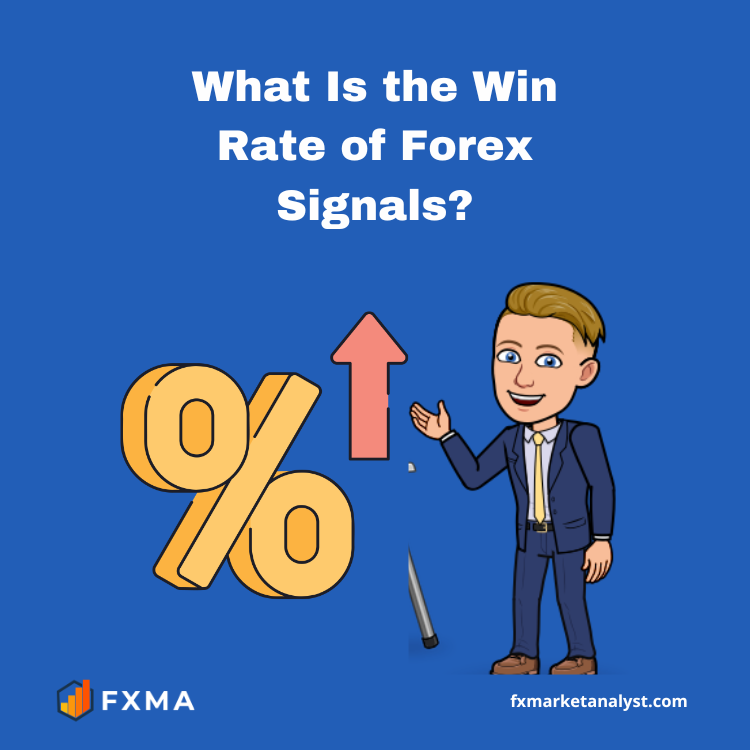
If you’ve explored forex trading, you’ve likely come across the term win rate. It’s one of the most commonly used metrics to evaluate forex signals, yet it’s often misunderstood or taken at face value. This guide explains what the win rate of forex signals actually means, how to interpret it, and why it should never be used in isolation. What Is the Win Rate of Forex Signals? Let’s start: What Does Win Rate Mean? The win rate of forex signals is the percentage of trades that close in profit out of the total number of trades taken. Formula: Win Rate (%) = (Winning Trades ÷ Total Trades) × 100 For example, if a signal provider has 65 winning trades out of 100 total trades, the win rate is 65%. What Is Considered a Good Win Rate? There is no single “ideal” win rate, but general benchmarks include: 50%–60%: Acceptable and workable 60%–75%: Strong and consistent Above 75%: High, but requires careful verification A higher win rate may appear attractive, but it does not automatically translate into profitability. Why Win Rate Alone Is Not Enough Relying only on win rate can lead to poor trading decisions. Several key factors must be considered alongside it. Risk-to-Reward Ratio A trader can have a high win rate and still lose money if losses are significantly larger than gains. Example: 9 winning trades: +10 pips each 1 losing trade: -100 pips Win rate = 90%, yet the overall result is negative. Trade Management Stop-loss and take-profit levels play a critical role. Without proper risk control, even a strong win rate cannot sustain long-term performance. Data Transparency Some signal providers may present inflated win rates by: Omitting losing trades Reporting only selected results Lacking third-party verification The Ideal Balance A more reliable approach is to evaluate forex signals based on a combination of factors: Win rate: Typically between 55% and 70% Risk-to-reward ratio: At least 1:1.5 or higher Consistency: Stable results over time Drawdown: Limited and controlled losses This balanced view provides a clearer picture of actual performance. Example Comparison Provider Win Rate Risk/Reward Outcome A 80% 1:0.5 Likely unprofitable B 60% 1:2 Potentially profitable In this case, the provider with the lower win rate performs better due to a stronger risk-to-reward structure. How to Evaluate Forex Signals Before subscribing to any forex signal service, consider the following: Is the performance verified through platforms like Myfxbook or FX Blue? What is the average risk per trade? Are stop-loss and take-profit levels clearly defined? Is the win rate consistent over several months? The win rate of forex signals is a useful metric, but it should never be the sole factor in your decision-making process. Long-term profitability depends on a combination of disciplined risk management, consistent strategy execution, and realistic expectations. A moderate win rate supported by strong risk-to-reward ratios and controlled losses is far more sustainable than a high win rate alone. Lastly, if you understand that forex signals can boost your trading activities and accuracy, FXMA is here to make your dreams come true. Also, read our other Blogs to learn more about Forex Signals.

Monthly ROI Analysis of Forex Signals
In the world of currency trading, performance metrics matter. Among them, Return on Investment (ROI) is one of the most commonly used indicators to evaluate the effectiveness of Forex signals. A monthly ROI analysis helps traders determine whether a signal provider is consistent, sustainable, and aligned with their risk appetite. This article breaks down how to properly assess monthly ROI, what numbers truly mean, and how to interpret forex signals performance beyond surface-level percentages. Monthly ROI Analysis of Forex Signals Let’s start: What Is ROI in Forex Signals? ROI measures the percentage return generated from an initial investment over a specific period. In Forex signal services, monthly ROI reflects how much a trader’s capital would have grown (or declined) if all signals were followed according to the provider’s rules. Basic Formula: ROI(%)=NetProfitInitialInvestment×100ROI(%)=InitialInvestmentNetProfit×100 For example: Starting capital: $5,000 Net monthly profit: $750 ROI = (750 / 5,000) × 100 = 15% While 15% may appear attractive, the real question is: At what level of risk was this achieved? Key Metrics to Review Alongside Monthly ROI Monthly ROI alone does not give the full picture. A reliable analysis should include: 1. Drawdown Maximum drawdown reflects the largest decline in account balance during the month. A 20% ROI with a 35% drawdown is far riskier than a 10% ROI with a 5% drawdown. 2. Risk-to-Reward Ratio If signals consistently risk 1% to gain 3%, the system is structured for long-term sustainability. Poor ratios often signal unstable performance. 3. Win Rate vs. Profitability A high win rate does not automatically mean strong ROI. Some systems show 80% winning trades but suffer heavy losses on the remaining 20%. 4. Trade Frequency Overtrading can artificially inflate monthly ROI but increases exposure to market volatility. Sample Monthly ROI Breakdown Here’s a simplified example of three months of signal performance: Month ROI Max Drawdown Win Rate January 8% 6% 62% February 12% 9% 58% March -4% 11% 51% Observations: February delivered the highest ROI but with increased risk. March showed a loss month, which is normal in trading. Consistency across months is more important than a single high-return period. What Is a Realistic Monthly ROI? In professional trading environments, consistent monthly ROI typically ranges between: 3%–8% with controlled risk 10%+ may indicate aggressive exposure 20%+ regularly often suggests high leverage or unsustainable risk Be cautious of signal providers advertising fixed or guaranteed returns. Forex markets are influenced by economic releases, geopolitical developments, and central bank policy decisions. Red Flags in Monthly ROI Reports No verified track record No mention of drawdown Screenshots without audited data Unrealistic compounding projections Absence of losing months A legitimate signal provider will show both winning and losing periods. How to Conduct Your Own Monthly ROI Analysis Track every signal executed. Record entry, stop-loss, take-profit, and lot size. Calculate net profit after spreads and commissions. Compare ROI against maximum drawdown. Evaluate consistency over at least 6–12 months. Using a trading journal or performance analytics tool helps maintain objectivity. Monthly ROI analysis is not about chasing the highest percentage. It is about evaluating risk-adjusted performance, consistency, and capital preservation. Sustainable Forex signal services demonstrate steady returns, manageable drawdowns, transparent reporting, and realistic expectations. Before subscribing to any provider, always analyze performance data carefully and align it with your personal risk tolerance and long-term trading goals. Lastly, if you understand that forex signals can boost your trading activities and accuracy, FXMA is here to make your dreams come true. Also, read our other Blogs to learn more about Forex Signals.